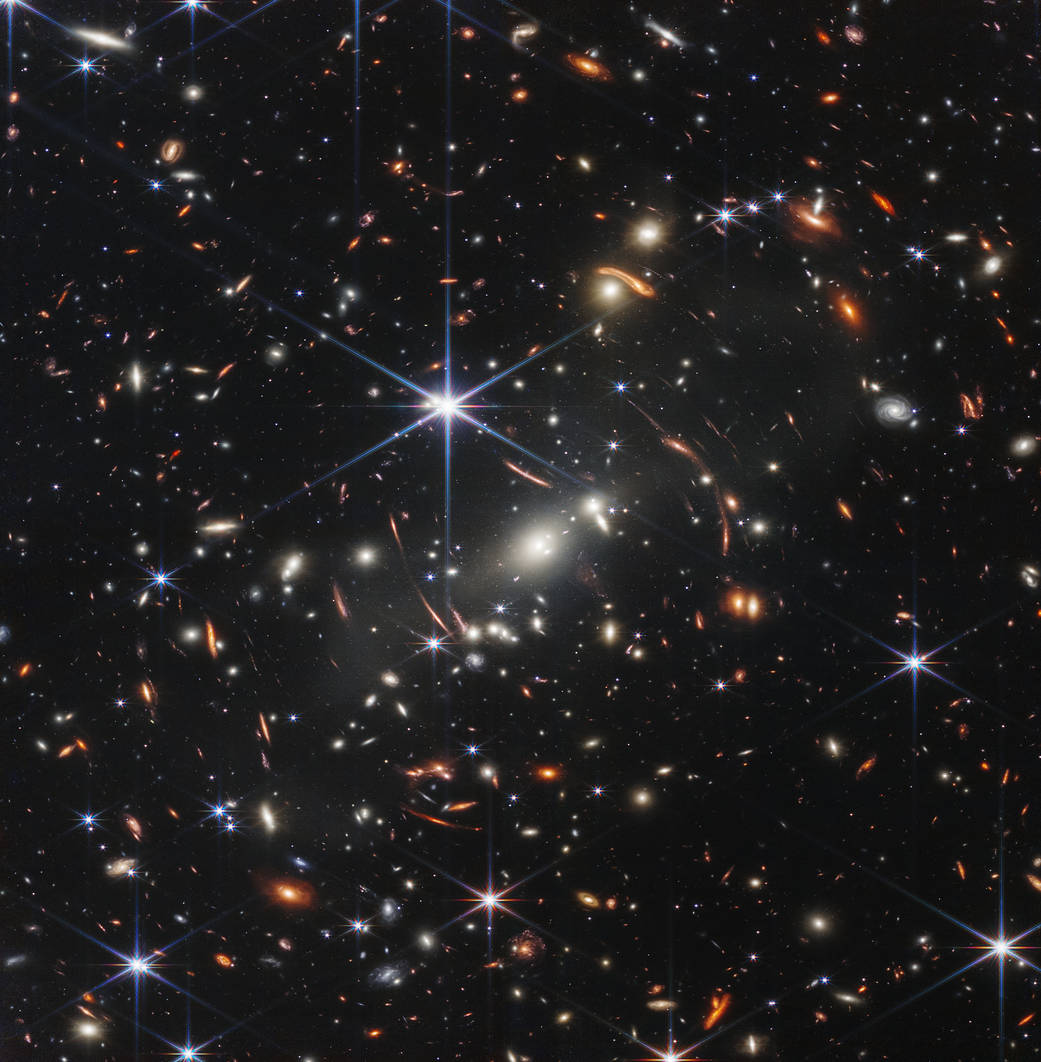
You have likely heard about the Universe expanding. Or that redshift can tell us about the movements of galaxies. Both are difficult ideas to imagine and understand.
In this activity, you will use a balloon to explore the expanding Universe. As part of your exploration, you will investigate the relationship between the distance to galaxies and the speed at which they move.
By the end of this activity you will:
- Have worked scientifically to carry out an investigation
- Have calculated speed using distance and time measurements
- Have plotted and interpreted a distance-speed graph
- Have looked at, and replicated, the evidence for the expanding Universe
- Have investigated the relationship between distance and redshift
To complete this activity you will need:
- To watch the 'How do we know the Universe is expanding?' video
- To read the instructions on this page
- The worksheet, or to create your own table of results
- A round balloon (do not use a long, thin one)
- At least 5 stick-on dots (make sure each is a different colour)
- A ruler
- A piece of string about 50cm long
- A stopwatch or other timer
Files Needed
Expanding-Universe-Worksheet-update.pdf
(175.79 KB)

Credit: NASA, ESA, CSA, and STScI
Approx Duration
15 - 30 mins
Have a go
Before you start:
- Download the 'Create an Expanding Universe' worksheet.
- Assemble your equipment
- Follow the instructions in the worksheets to fill in your table of results
Now follow the instructions on the worksheet:
- Select your “Milky Way” colour sticker. Fill the colours of your stickers into the table
- Blow the balloon up at little bit, and stick your dots all over the balloon
- Use the string and ruler to measure the distances from the Milky Way dot to each of the other dots
- Now blow the same balloon up fully while timing how long it takes to expand
- Repeat your measurements for each dot
- Calculate the speed at which your coloured dots have moved
- Plot a graph of the speed and distance of each coloured dot
- Add a line of best fit to the points on your graph
- Answer the questions on the worksheet
If you liked this, why not try
