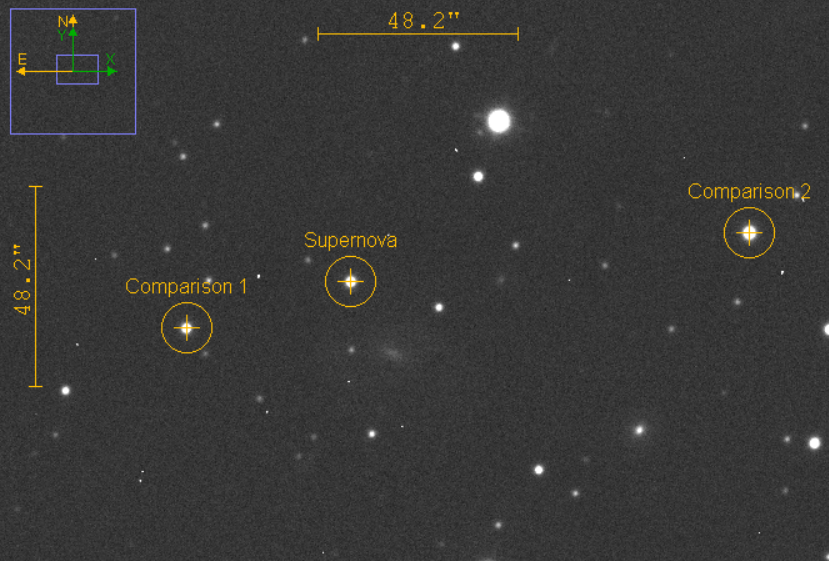
Supernovae are exploding stars which increase in brightness very suddenly and unexpectedly.
We need you to help us analyse data collected by the Gaia Space Telescope. By measuring the brightness of a supernova and plotting how it changes over time, you will help us understand more about these powerful stellar objects.
By the end of this activity you will:
- Have used software to view and analyse real data
- Have done photometry on several stars (measured how bright they are)
- Have created a light curve for a supernova (a plot of brightness over time)
To complete this activity you will need:
- The Supernovae project webpages
- The Gaia16agf data files (download zip file)
IT Equipment
- Access to the internet
- MS Excel and the Magnitude Calculator spreadsheet - if you are new to spreadsheet software, use this MS Help Sheet
- Image Software that can open astronomical data files

Credit The Schools' Observatory
Approx Duration
60+ mins
Have a go
Visit the Supernovae project. Use the items in the menu to:
- Find out what we know about supernovae
- Learn how we detect supernovae
- Read through the instructions
- Learn how to use the software
Then you’re ready to use your knowledge to analyse data returned by the Gaia Space Mission!
You can then share your results with us by completing our online form.
If you liked this, why not try
