
The Sun is a constant presence in our life on Earth. It gives us the heat and light we need to survive. But it is not a stable place. The Sun is a ball of hot plasma which is constantly changing.
Some of these changes have implications for life here on Earth.
Why not learn more about the solar cycle and its effect on Earth? Use data from the Solar Dynamics Observatory to look for patterns in solar activity. You can help predict when we will next experience some explosive space weather!
By the end of this activity you will:
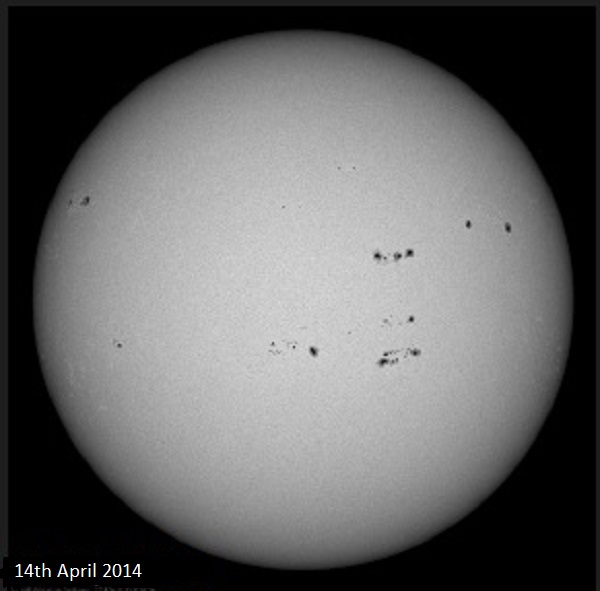
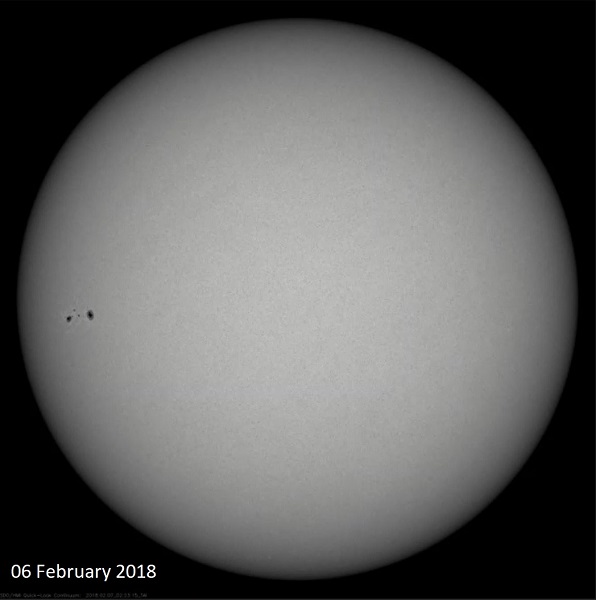
- Have investigated observations of the Sun's surface from the Solar Dynamics Observatory
- Have compared the Sun's surface at different periods in the Solar Cycle
- Have analysed sunspot counts over different timescales to look for patterns in the data
- Have used your results to predict the next solar maximum
To complete this activity you will need:
- To watch the video above
- To follow the directions in the worksheet
- SDO images of the Sun
- The spreadsheet of Sunspot data
IT Equipment
- Spreadsheet software (e.g. MS Excel) - if you are new to spreadsheet software, use this MS Help Sheet
Have a go
Download and open the spreadsheet 'solar_cycle.xls'
Watch the video on this page and follow the instructions in the worksheet.
When you're finished you might want to check what we expect the solar cycle to look like.
To learn more about what causes the solar cycle watch the video below about what we can see on the Sun.